
10+ Inspiring Activities for Teachers Using the Spreadsheet, Chart, and Active Plot Widgets
 Chelsey Both —
Teaching data skills to students can feel overwhelming, but with the right tools it becomes engaging and even fun. The math-focused Spreadsheet, Chart, and Active Plot Widgets from BookWidgets make it easier to design interactive math activities that bring data to life. Yet these widgets go beyond math: you can also use them creatively for other purposes, such as a reading log or a mood tracker. With these hands-on classroom tools, students can work with spreadsheets, interpret automatically generated charts, and explore graphing in real time, building both confidence and a deeper understanding of data along the way.
In this blog, you will discover:
- Digital Spreadsheet Activity
- Interactive Chart Lesson Idea
- Active Plot Exercise
- 10+ Ready-to-Use Activities to Inspire Your Lessons and Engage Students
- Collecting and Viewing Student Results
If you want to discover more math activities, be sure to check out this blog: 'The Ultimate Classroom Collection of 30+ Free Interactive Math Activities'. 📊
Digital Spreadsheet Activity
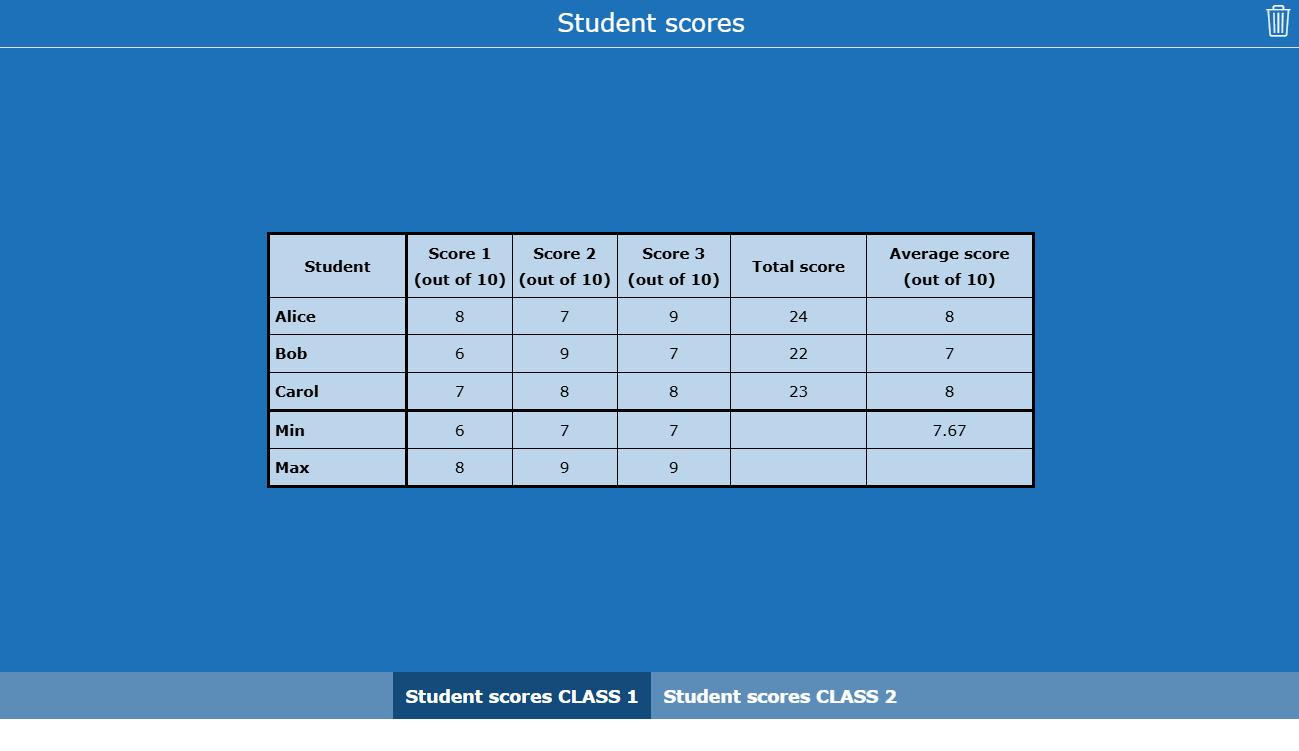
 The Spreadsheet Widget lets you create simple spreadsheets activities where students can input data and see how formulas work in real time. You can lock certain cells or pre-fill formulas to guide their input and ensure they only edit what you want. This helps students focus on practicing specific skills without accidentally changing important parts of the sheet. As students adjust the data entries, the fields with pre-set formulas automatically update, allowing them to see the results instantly and understand how the calculations work.
This simple example is designed to show you how the Spreadsheet Widget works and to explore a few of its features. In this activity, there are two tables, but you can also work perfectly with just one table. Try changing the scores of one or more students and discover how the calculations update automatically 👇
Interactive Chart Lesson Idea
 The Chart Widget allows students to enter data into a table and instantly see it represented in a stacked bar chart. This visual approach helps them grasp relationships and patterns much faster than raw numbers alone. Teachers define the structure of the table in advance, guiding students to focus on interpreting the data rather than building the chart from scratch. As students fill in the values, the chart updates in real time, reinforcing the connection between numbers and visuals.
In this lesson example, you give your students an overview of the week. Fill in a 0 if the subject is not taught that day and a 1 if it is. This simple activity helps you understand how the Chart Widget works 👇

💡 Pro Tip! You can hide the table and display only the chart by clicking the table icon in the top right corner.
Active Plot Exercise
 The Active Plot Widget helps students develop intuition for math formulas by letting them adjust parameters and instantly see the graph change. By entering a formula, teachers create an interactive plot where students can explore how different values affect the shape and behavior of the graph. This hands-on approach encourages deeper understanding of mathematical relationships and supports active learning.
This activity lets you explore key features of the Active Plot Widget. In this example, the dots on the graph will change as students adjust the parameters. Try it out and change the parameters 👇

💡 Pro Tip! You can allow students to make annotations on the plot for added interactivity.
10+ Ready-to-Use Activities to Inspire Your Lessons and Engage Students
Spreadsheet Examples
1. Vacation Reading Log
Want to motivate your students to read during the school break? This vacation reading log lets them keep track of what they’ve read, how much time they spent reading, and any new words they discovered. It’s a simple way to combine reading enjoyment with basic spreadsheet practice. A great follow-up for any language or literacy lesson after the break.

2. Weather Tracking Template
Looking for a fun and easy weather observation activity for your classroom? This temperature tracking spreadsheet is perfect for teaching basic geography skills and data handling. Each student takes on the role of "Weather Reporter" for a week, measuring and logging temperatures daily. After several weeks, your class will have created a complete dataset perfect for a geography lesson on weather patterns.

3. Student Mood Tracker
Help your students slow down and reflect with this daily mood tracker activity. Using a simple spreadsheet, students rate their mood, choose an emoji, and describe their day in a few words. They can find the explanation of the mood numbers in the instructions. The goal is to help them recognize and reflect on their emotions. In primary schools, it works well as a calming routine at the end of the school day. In secondary schools, it can be used after a class to check if students understood the lesson or to understand how they feel about the class. This activity is an excellent follow-up for any SEL lesson.

4. Sports Score Spreadsheet
This sports-themed exercise features a split worksheet layout, with the spreadsheet on the left side and guided questions on the right. Students adjust values to see how points and rankings change, encouraging hands-on learning and critical thinking. By exploring formulas and data relationships, they gain practical experience with real-world math concepts in an engaging context.

5. Engaging Fantasy Story Writing Activity
Boost creativity in your writing or language class with this Fantasy Character Stats activity. Students develop a main character, optionally add side characters, and create a short story that matches their character’s traits. Using a spreadsheet, they organize stats like HP, Strength, Magic, and Agility, connecting storytelling with structured data. This activity encourages reflection, consistency, and engagement, making writing exercises more interactive and visual. You can use this lesson to inspire imagination while reinforcing language skills and character development.

Chart Examples
6. Fruit Survey Chart Activity
Engage your students with a fun and interactive fruit preference survey using a simple table within the Chart widget. Students ask five family members which fruits they like and fill in the table by entering 1 for “like” and 0 for “don’t like.” We added the stacked bar chart to the split worksheet so students can view the chart while answering the questions. As they input their answers into the chart, it updates automatically, showing clear, colorful visualizations of the data. This lesson helps students practice collecting and interpreting data while exploring digital tools for visualization. It’s a perfect homework assignment that connects classroom learning with family involvement, making math meaningful and engaging.

7. Science Experiment Bar Chart
Kick off your science lesson with this fun and hands-on reaction time activity using the Chart widget. In small groups, students take turns dropping and catching a ruler, then record how far it falls before being caught. Each group fills in a table, and the results are instantly shown in a bar chart. It’s a quick ice breaker activity that introduces students to reaction times and shows how they can vary from person to person.

💡 Pro Tip! You can choose whether students can edit the row headers and column headers. You can also choose to allow them to edit only one of the two, while keeping the other fixed.
8. Sustainability Habits Activity
Have your students track their eco-friendly actions throughout the week using the interactive Chart widget. Each student fills in their own row with how often they perform sustainable behaviors. As they enter their data, the stacked bar chart updates automatically, providing a clear visual of the class’s habits. Afterwards, use the chart for a classroom discussion to reflect on individual choices and overall trends. This digital classroom activity helps develop data analysis skills while connecting environmental awareness with meaningful conversation.

9. Candy Budget Challenge
Challenge your students’ budgeting and problem-solving skills with this fun Candy Budget Challenge. Students receive a budget of $15 and must choose from three types of candies, each priced differently. Their goal is to find combinations that maximize the number of candies without exceeding the budget. This interactive activity encourages critical thinking and practical math application, including addition, multiplication, and inequalities. It’s a sweet way to engage learners while reinforcing important financial literacy concepts.

10. Dice Probability Game
This probability classroom activity helps your students practice addition while exploring how chance works. By rolling two dice and counting the sum 20 times, your class gathers data that shows patterns in probability. You can use this math dice game to make difficult concepts more concrete and engaging. It is an easy way to add hands-on learning to your math lessons and introduce probability in a fun, interactive way.

💡 Pro Tip! In the instructions for this exercise, we included a link to a dice widget so you can do this activity even if you don’t have dice in the classroom.
Active Plot Examples
11. Waves in a String Simulation
Explore the physics of waves with this interactive Waves in String activity. Students can adjust key parameters like amplitude, damping, and frequency to see how each affects wave behavior in real time. This hands-on approach helps deepen understanding of wave properties and energy loss, making abstract concepts tangible. By experimenting with different settings, students develop intuition about oscillations and damping effects. It’s a powerful way to engage learners and reinforce core physics principles through visual and interactive learning.

12. Interactive Sine and Cosine Graphs
This interactive Active Plot activity helps students understand the fundamental concepts of sine and cosine functions. By adjusting the parameters a and b, they can see in real time how tall the waves are (amplitude) and how the graph moves up or down (vertical shifts). This hands-on approach clarifies the differences and similarities between sine and cosine waves, deepening comprehension of periodic functions. Experimenting with the sliders builds intuitive insight into wave behavior and function transformations. It’s an engaging tool to strengthen math skills through interactive learning.

13. The Equation of Love
As a fun icebreaker, you can use an Active Plot to surprise your students with a graph that draws a heart. In this exercise, the special heart-shaped formula is already added, so the graph instantly takes shape, showing how math can be both creative and visual. You can add more formulas to demonstrate how they look on a graph and spark curiosity about patterns in graphs. This quick activity not only grabs attention but also demonstrates how formulas translate into visual patterns on a graph.

14. Hidden Image Plotting Game
In this Split Worksheet Widget activity, students practice plotting points and connecting them by following instructions to uncover a hidden image. It is a fun activity to end your class with.

💡 Pro Tip! Don’t have enough scientific calculators for the class? No worries! In the ‘General’ tab, turn on the embedded calculator for students to use.
Collecting and Viewing Student Results
1. Managing Student Submissions
If you want students to be able to submit their exercises, you need to enable “Enable submitting of answers” in the Reporting tab of the widget settings. This option is by default turned off. Once enabled, students can send their completed exercises directly to you, making it easy to check and provide feedback later. This submission feature is available for the Spreadsheet and Active Plot Widget. The Chart Widget can't be submitted.
Once the option is turned on, you can further customize the submission form and you can set a maximum score for the exercise.

2. Live monitoring
The advantage of the Chart widget is that it supports live monitoring, allowing you to track student progress in real time and see how they interact with the chart. The information on this dashboard is updated live! You can see the names of your students, a timestamp showing how long it has been since BookWidgets recorded activity for each student, and their progress.
This is the live monitoring dashboard for the dice example. The first student completed their exercise 6 minutes ago, indicated by the green progress bar. The second student made a change 4 minutes ago but has not finished yet.

💡 Pro Tip! Make sure the table in the Chart widget is empty before students start. If it already contains data, the live monitoring dashboard may incorrectly show the activity as completed.
Live monitoring is only available for widgets that support this feature and are shared through a Learning Management System such as Google Classroom, Microsoft Teams, etc. The Spreadsheet and Active Plot widgets do not support live monitoring. If you want to learn more about live monitoring in other widgets, make sure to check out this blog.
Wrap Up
That’s it! Hopefully this collection of interactive spreadsheet, chart, and Active Plot activities has sparked ideas for bringing data to life in the classroom. These tools are designed to spark curiosity, strengthen skills, and show how engaging data becomes through hands-on exploration. Allowing learners to experiment and visualize information fosters understanding that reaches far beyond math lessons.
Do you have your own creative ways of using BookWidgets data widgets? We’d love to hear from you! Share your ideas with us on Bluesky, Instagram, or join our Facebook teacher community to exchange inspiration with educators around the world.

